Real HF transmission lines, in particular coaxial cable, are not perfect conductors of HF energy,
and will therefore lead to a certain amount of RF signal loss along their length. Depending on the type and length of transmission
line, and the operating frequency, these losses can be quite substantial.
For single-band antennas, such losses are negligible around the resonant frequency. For multi-band antennas -
such as OCFD, EFHW antennas, and half-square antennas configured as voltage-fed EFHWs - the losses are also
negligible at the various resonant frequencies, but can become very significant at frequencies where the antenna
is not resonant:

40-meter EFHW antenna - chart of VSWR at the feed-point
In this example, showing only VSWR values at the antenna feed-point, very high VSWR values are seen at the
frequencies where the antenna is not resonant, i.e at the 30m, 17m and 12m bands.
By introducing a configurable length and type of coax cable into the analysis, however, it is possible to
transform such high values to ones more accessible to a good antenna tuner:

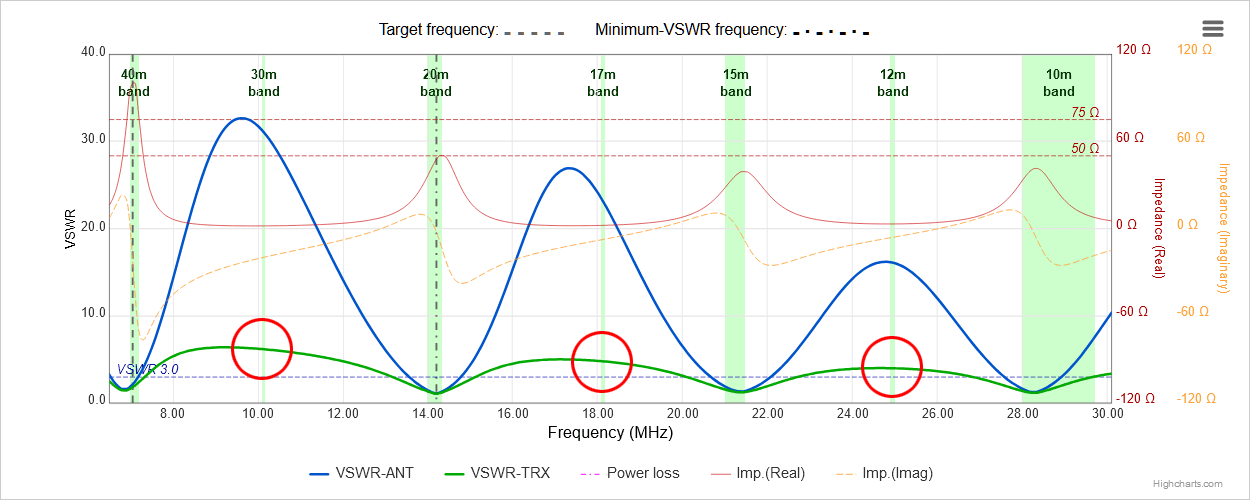
40-meter EFHW antenna - chart of VSWR at feed-point, and at the transmitter end of a length of coax
Here, the green curve shows the VSWR values to be expected at the transmitter end of a length of coax (in this
example, 12 meters of RG-316 U coax). It is apparent that the resulting VSWR values at the 30m, 17m and 12m bands
are much more amenable to tuning below 3:1 by a decent antenna tuner; it should be understood that this comes at the
penalty of higher signal loss.
The following section shows how such losses, and hence VSWR curves at the transmitter end of a length of coax, are
calculated.
The input impedance of a real, lossy transmission line is computed using the
Transmission Line Equation which can take
several forms. Here we use a variation using hyperbolic trigonometric functions, after
ARRL Antenna Book, 20th Edition, p. 24-12:
\[
Z_{\mathrm{in}}
= Z_0 \,
\frac{ Z_L \cosh(\gamma l) + Z_0 \sinh(\gamma l) }
{ Z_L \sinh(\gamma l) + Z_0 \cosh(\gamma l) }
\]
where
\( Z_{\scriptstyle \mathrm{in}} \) = complex impedance at input of coax line
\( Z_{\scriptscriptstyle \mathrm{L}} \) = complex load impedance at end of coax line,
i.e. at the antenna = \( R_{\scriptstyle \mathrm{a}} \pm j X_{\scriptstyle \mathrm{a}} \)
\( Z_{\scriptstyle \mathrm{0}} \) = characteristic impedance of coax line = \( R_{\scriptstyle \mathrm{0}} + j X_{\scriptstyle \mathrm{0}} \)
\( l \) = physical length of coax line in meters
\( \gamma \) = complex loss coefficient = \( \alpha + j \beta \)
\( \alpha \) = matched line loss attenuation constant, in nepers per unit length
(1 neper = 8.68589 dB; cables are rated in dB per 100 meters)
\( \beta \) = phase constant of coax line in radians per unit length
= \( \dfrac{2 \pi} {F_{\scriptstyle \mathrm{v}} L_{\scriptstyle \mathrm{w}}} \)
for \( F_{\scriptstyle \mathrm{v}} \) = velocity factor of coax line,
and \( L_{\scriptstyle \mathrm{w}} \) = wavelength = \( \dfrac{300} {f_{ \mathrm{MHz}}} \)
We can expand the first expression, separating out the real and imaginary parts in the sinh and cosh arguments:
\[
Z_{\mathrm{in}}
= Z_0 \,
\frac{ Z_L \cosh\bigl(l(\alpha + j\beta)\bigr) + Z_0 \sinh\bigl(l(\alpha + j\beta)\bigr) }
{ Z_L \sinh\bigl(l(\alpha + j\beta)\bigr) + Z_0 \cosh\bigl(l(\alpha + j\beta)\bigr) }
\]
This second expression is then expanded fully, using standard identities for hyperbolic sines and cosines of complex numbers.
This is the basis of the code used to calculate the value of \( Z_{\mathrm{in}} \) :
\[
Z_{\mathrm{in}}
= Z_0 \,
\frac{
Z_L\Bigl(\cosh(l\alpha)\cos(l\beta) + j\,\sinh(l\alpha)\sin(l\beta)\Bigr)
+ Z_0\Bigl(\sinh(l\alpha)\cos(l\beta) + j\,\cosh(l\alpha)\sin(l\beta)\Bigr)
}{
Z_L\Bigl(\sinh(l\alpha)\cos(l\beta) + j\,\cosh(l\alpha)\sin(l\beta)\Bigr)
+ Z_0\Bigl(\cosh(l\alpha)\cos(l\beta) + j\,\sinh(l\alpha)\sin(l\beta)\Bigr)
}
\qquad \text{Eq. (1)}
\]
Since, for a given setup, all of these values except frequency are constant,
\( Z_{\scriptstyle \mathrm{in}} \) will vary only with frequency.
Once the value of \( Z_{\scriptstyle \mathrm{in}} \) has been established for a particular combination of antenna,
coax feed-line and frequency, we use the following expression
(from a letter in the Technical Correspondence section of QST magazine, November 1997, p70-71)
to calculate the loss in dB due to VSWR:
\[
L_{\scriptscriptstyle \mathrm{VSWR}}
= 10 \, log_{\scriptscriptstyle \mathrm{10}} \!
\left(
\frac{1 - \lvert \rho_{\mathrm{in}} \rvert^2}
{1 - \lvert \rho_{\scriptscriptstyle \mathrm{L}} \rvert^2}
\right)
\qquad \text{Eq. (2)}
\]
where
\( L_{\scriptscriptstyle \mathrm{VSWR}} \) = loss in dB due to VSWR
\( \lvert \rho_{\mathrm{in}} \rvert \) = the magnitude of
\( (Z_{\scriptstyle \mathrm{in}} - Z_{0}^{*}) / (Z_{\scriptstyle \mathrm{in}} + Z_{0}) \)
\( \lvert \rho_{\mathrm{L}} \rvert \) = the magnitude of
\( (Z_{\scriptstyle \mathrm{L}} - Z_{0}^{*}) / (Z_{\scriptstyle \mathrm{L}} + Z_{0}) \)
\( Z_{0}^{*} \) = complex conjugate of the feed-line characteristic impedance
\( R_{\scriptstyle \mathrm{0}} + j X_{\scriptstyle \mathrm{0}} \)
(for most common varieties of coax cable, \( Z_{0}^{*} \) will simply be 50 Ω)
This expression avoids problems associated with possibly negative values of VSWR by using complex impedances and
thus eliminating VSWR from the calculation.
In calculating losses for a particular combination of antenna and coax feed-line
over several frequencies, it is necessary to
calculate both equations (1) and (2) for each distinct frequency. The number of frequencies at spacings of ~20kHz for a VSWR curve
over a single band is on the order of 40 or 50.
When a VSWR curve is displayed covering several bands - say the 40m to 10m bands inclusive for an EFHW or OCFD antenna -
the number of distinct frequencies can amount to several hundred, depending on the frequency steps used.
The equations (1) and (2) must then be run for each of these distinct frequencies.

